Plotting shapefiles with ggplot2 (+ a gganimate example)
By Paul Villanueva in Presentations
November 10, 2020
I was cleaning through my repos and I found slides I made for a workshop I gave at LunchinatoRs, Iowa State University’s Department of Ecology, Evolution, and Organismal Biology weekly R meeting. It was a short presentation meant as a crash course in the basics of plotting shapefiles in ggplot2, with a little animation as a little atreat.
You can see the slides here and find the repo here.
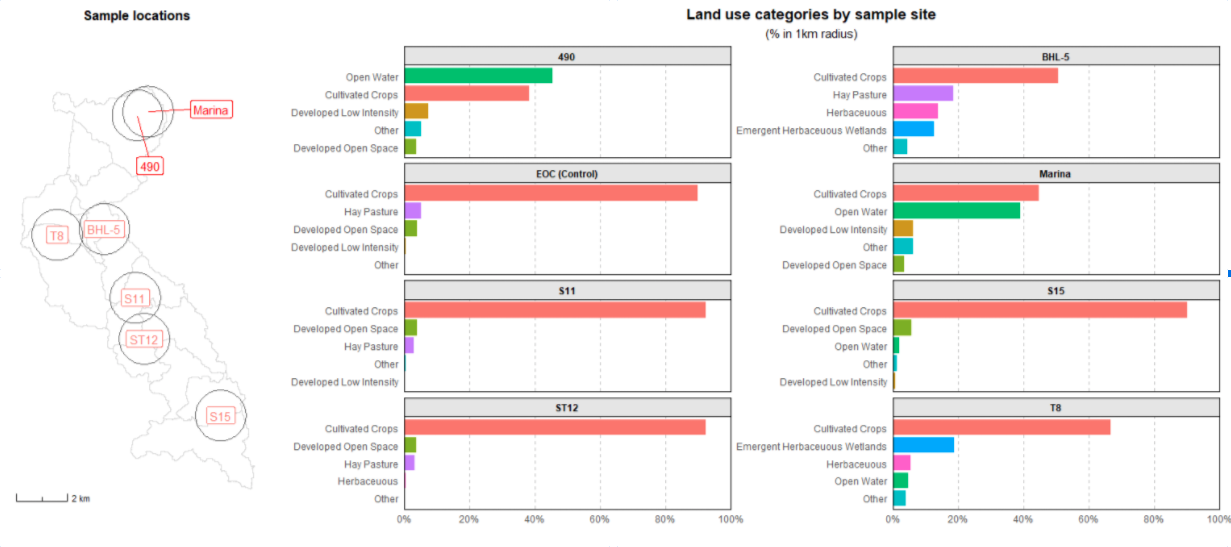
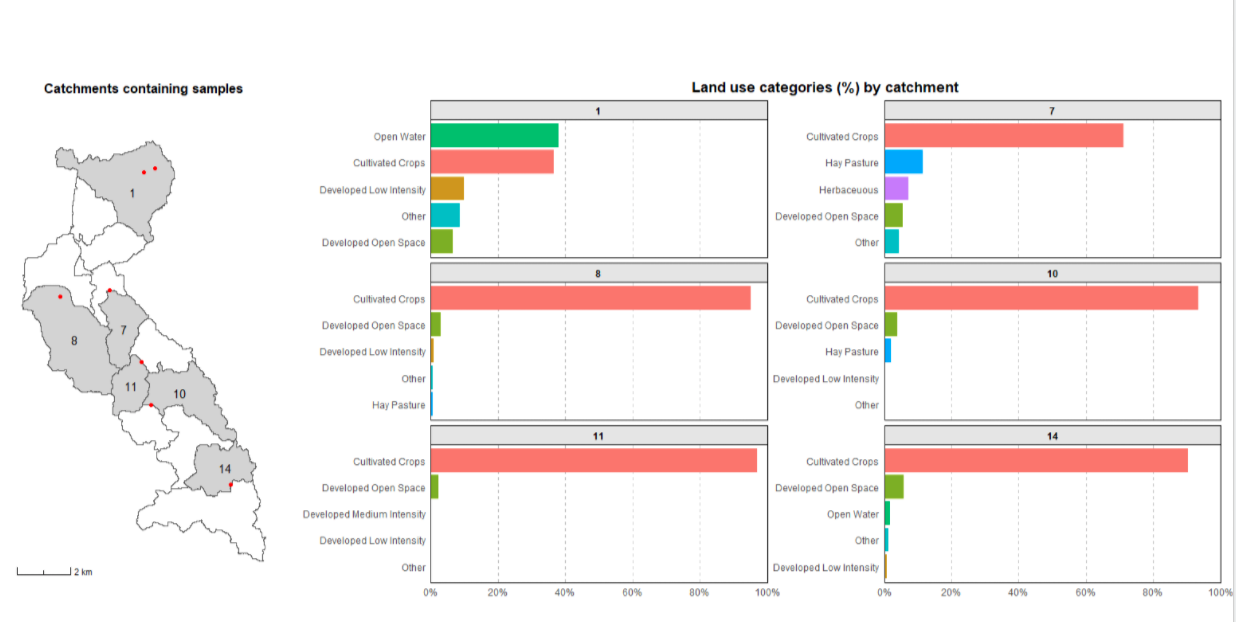
I plot a fair amount of maps in my research, usually as a nice figure to show where our samples are coming from. Other times I use it shapefiles and GIS layers to generate more data for our experiments. For example, I made these plots for an earlier project. Like most of my research, we were investigating human impact on the environment - this time, in particular, how agricultural practices in surrounding areas impacted water health in Iowa lakes. As part of our data gathering, we used land use classification data from MRLC as an additional data point. At some point, I made these plots to show where the samples were taken from and to measure what percentage of surrounding land corresponded to which land use categories: